Now We’re Cooking With Gas!
This week we have a truly exciting announcement to make. After months of software development, trial and error, GridDuck has now successfully integrated gas and water monitoring alongside electricity. We can now offer our customers an all-in-one solution to cutting utility waste. Read on to find out what new features are included, and why we decided to make this upgrade.
Since we began as a basic electricity monitoring offering, GridDuck has grown in ambition and scale. With automation and advanced automation working in sites across manufacturing, hospitality, office spaces, the public sector and agriculture, our most recent undertaking has been to integrate gas and water submetering. We believe that GridDuck should be the all-in-one utility monitoring solution for businesses small and large. Today, we have taken a huge step towards that goal, with gas and water submetering data officially added to our dashboard system.
What’s more, we’ve taken the opportunity to redesign our interface, adding a summary page to make total monitoring even easier for our customers. This comes after several other improvements to our data page, with our ‘Zoom and Enhance’ in place alongside more display and analytical features.
Why Integrate Gas?
Some may ask why exactly we felt it was so important to make this advancement, and why now in particular? What are the advantages of triple monitoring, and gas monitoring in particular?
We’ve written one article explaining in full detail why it pays to invest in triple utility monitoring. You can read the full piece here, but the key points are as follows:
Gas prices are on the rise, and you certainly did not need us to tell you that. Not only did “the energy market see a 250% increase in wholesale gas prices just in the first half of 2021” but February 2022 brought with it the infamous 54% domestic energy cap increase, due in part to rising wholesale gas prices. With governments bringing in unprecedented legislation to financially compensate households, many of us have been asking: what about businesses?
This 2022 price cap increase may apply to domestic buildings, but with many companies’ contracts coming to an end in spring of this year, energy intensive industries are likely to face higher outgoings for energy. What’s more, the devastating violence in Ukraine means more gas price rises are on the horizon. As one recent Guardian article states, Dr Amrita Sen, a founding partner and the chief oil analyst at the research consultancy Energy Aspects, said the group was working on the assumption that oil could “easily” rise by 50%.”
Traditionally, heating water has always been more expensive with electricity than gas. However, as gas prices rise, this means that hot water will likely become more expensive for your business too. Wasting hot water is going to cost you in years to come, much like wasting gas or electricity. With that in mind, we are determined to help our customers save in every area. We believe that this is the only way to minimise costs as well as optimising your business’s environmental impact.
Our Triple Monitoring System
Hopefully our motivation for this new advancement is now clear, but what exactly does our triple monitoring system look like? What features does it include, and what were our objectives in developing gas and water monitoring as part of GridDuck’s system?
We were able to start submetering gas by using pulse meters. These meters take readings every 5 minutes, providing a wealth of data for each daily, weekly and monthly period. Our hot water meters are attached to each sites’ hot water pipe, also providing data at 5 minute intervals. For the time being these newly-added utilities are provided as monitoring options, however, much like with electricity, we hope to be able to offer automation for gas and water in the future too.
As part of our new triple monitoring system, we felt it was important to ensure this new utility data was presented in a helpful way. We wanted to deliver a system where users can gain all of their utility data quickly and from one page, with intuitive comparison and analytical features at our customer’s disposal.
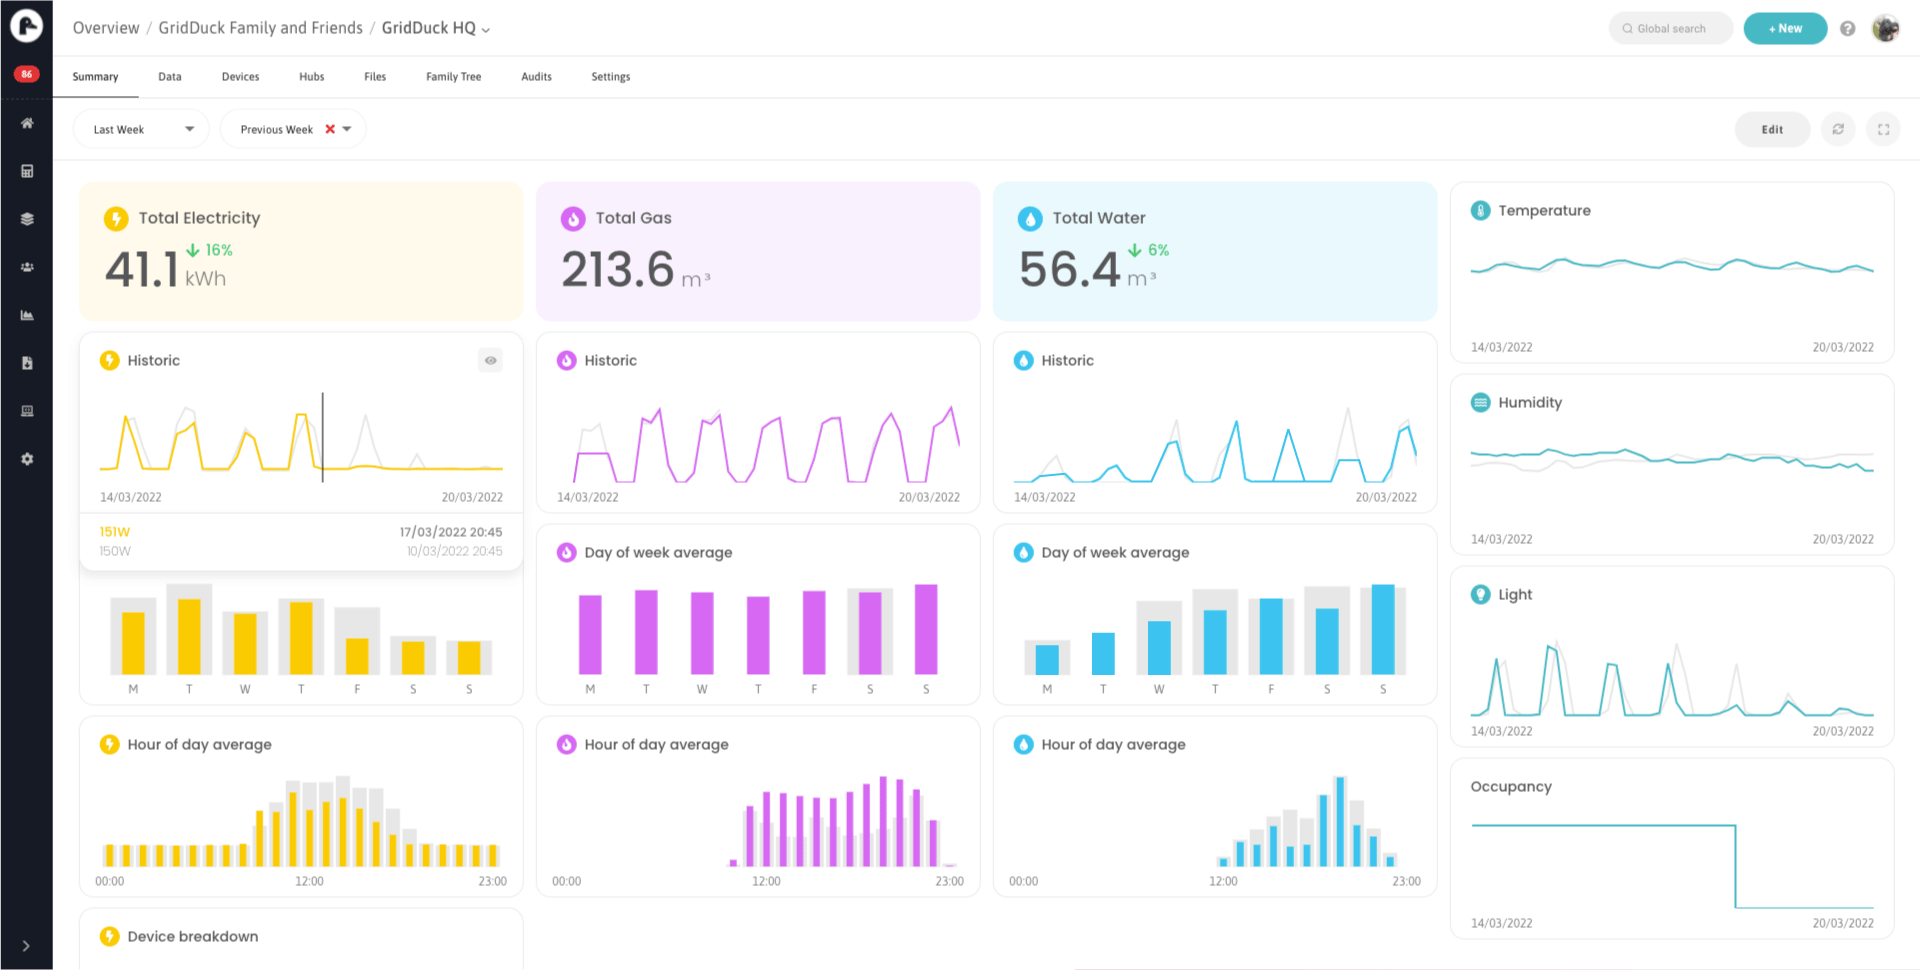
The very centre of GridDuck’s triple monitoring is our new Summary Page, which allows customers to get an overview of any type of data available, including each utility as well as sensor data (temperature, humidity etc.). This way, we believe our customers will be able to spot the most crucial information for costing and sustainability control even when they are short on time.
As part of our new summary page, we also offer several features which allow users to go more in depth, and to customise their insights. These include ‘Day of Week’ average profiles, ‘Hour of Day Average’ profiles, ‘Device Breakdown’ and ‘Historic Line Graph’ options. Furthermore, whilst each utility or data subgroup is summarised through a simple, colour-coded widget, customers can also change the layout of these widgets or show them full-screen as part of a presentation. As we roll out these changes, we aim to make the page even stronger, with custom prompts and alerts available as widgets too.
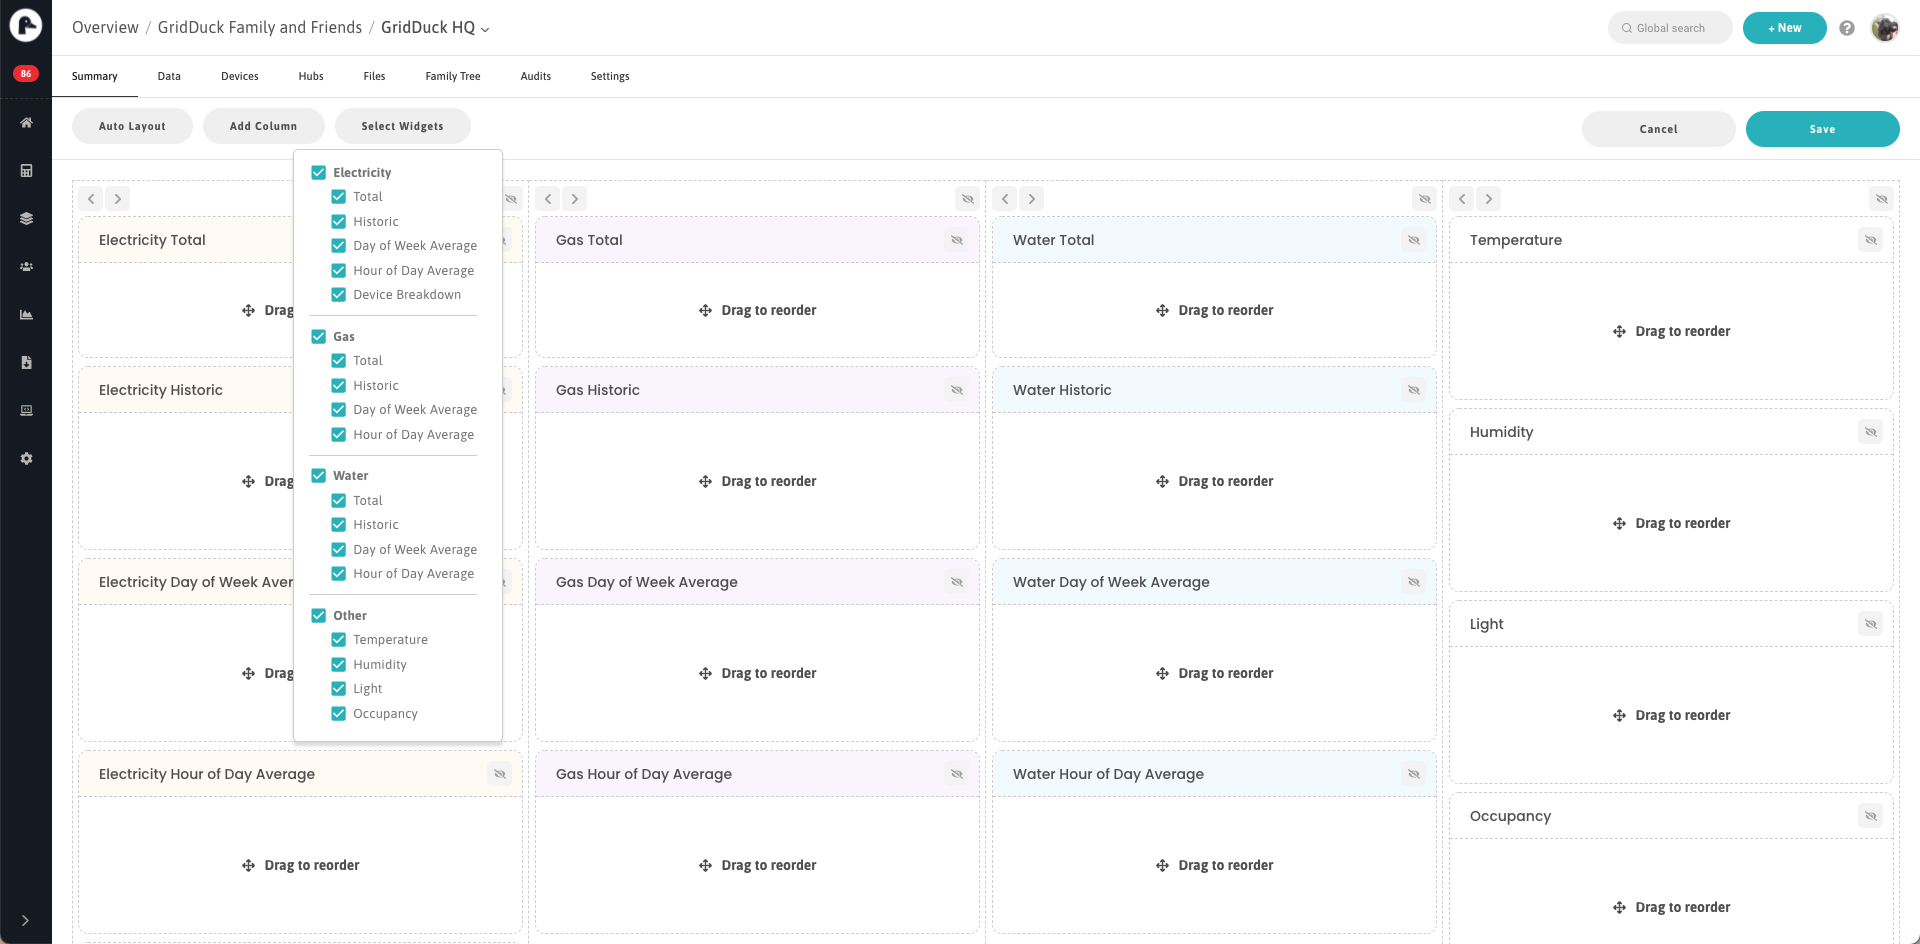
Our Summary page with edit options for choosing which data widgets are visible
For now though, we are extremely excited about these new features, and believe that our system now holds the potential to save almost any business significant amounts of money and carbon, whilst also gaining greater control.
Whether you run a gas-intensive commercial kitchen, or perhaps an electricity-intensive factory, or even a water intensive farm site, we can help. It’s time to start submetering!
To learn more about triple monitoring with GridDuck, please arrange a 15 minute, no-obligation call with Miles today using Calendly.